Lifespan of News Stories
October, 2017
News stories have a life cycle: they break, they are covered for a while, and then they fade into irrelevance. The goal of this project was to quantify the lifespan of news stories, and to study how that lifespan has varied over time.
I extracted about 17GB of data from the New York Times containing the first paragraph of every article they have every published (from 1851 to present). Using basic text analysis techniques like tokenization and stemming, I computed the frequency of articles about any given topic as a function of time. For example, this plot shows the frequency of the word stem for "war" over time:
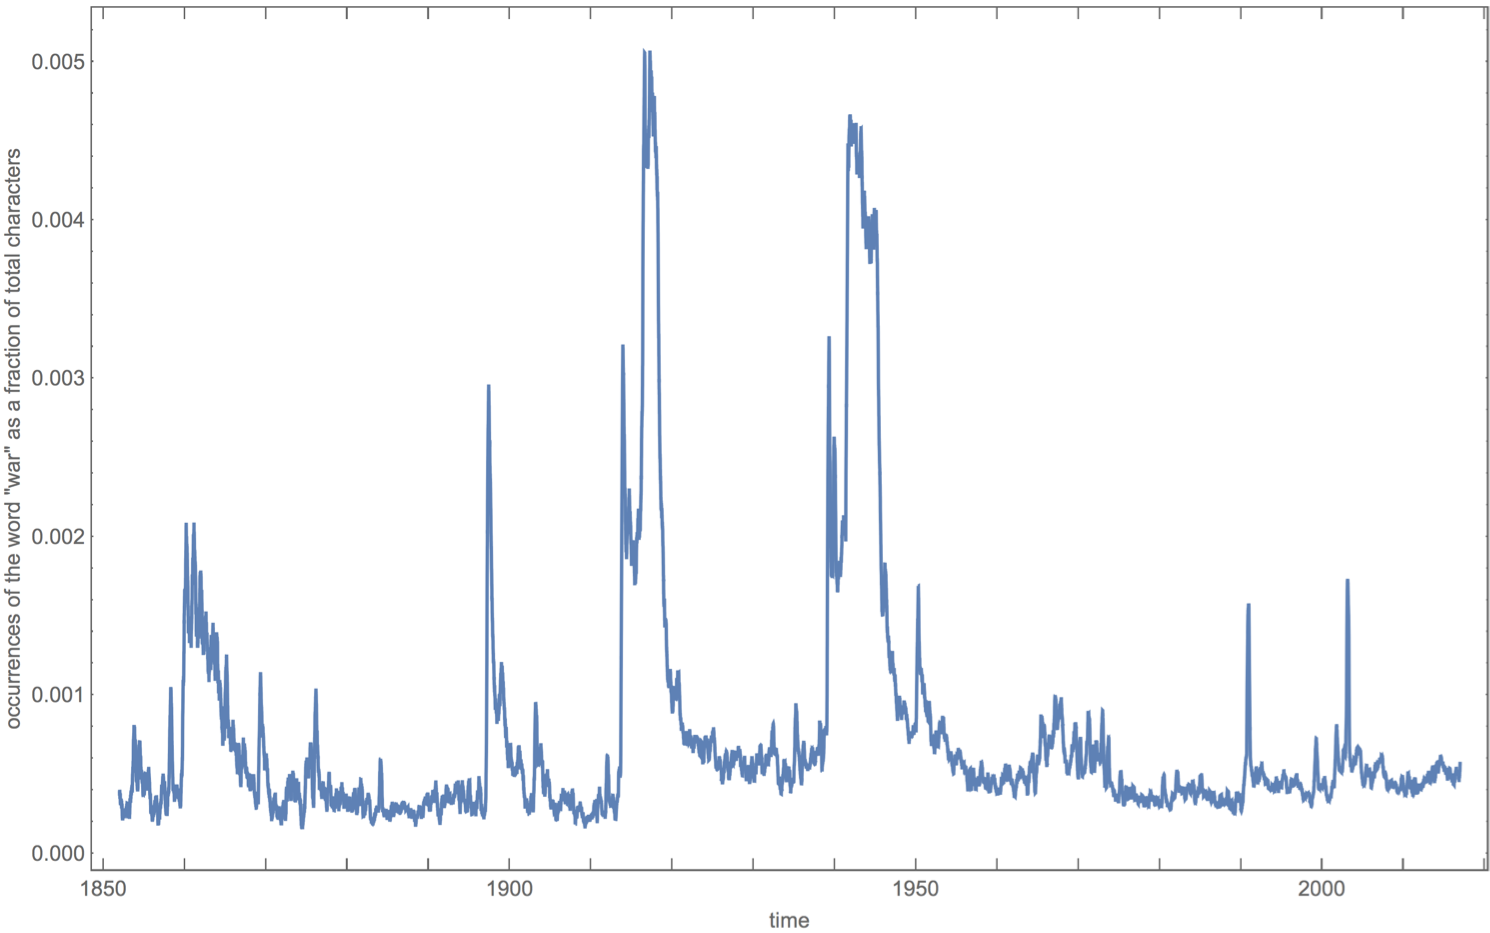
It is easy to spot essentially every major war involving the US as a peak in that plot, which shows how this data can reflect real-world events. News stories are generally represented as peaks with a falloff (and sometimes a lead up).
I created an algorithm for finding the "average peak" within one of these time series, essentially showing the average life cycle for a story about the given topic. By analyzing these average peaks, it is possible to measure which topics longer or shorter lifespans, or which topics have lead ups (like elections) and which don't (like natural disasters). For example, this plot shows the average peak for stories about tsunamis:
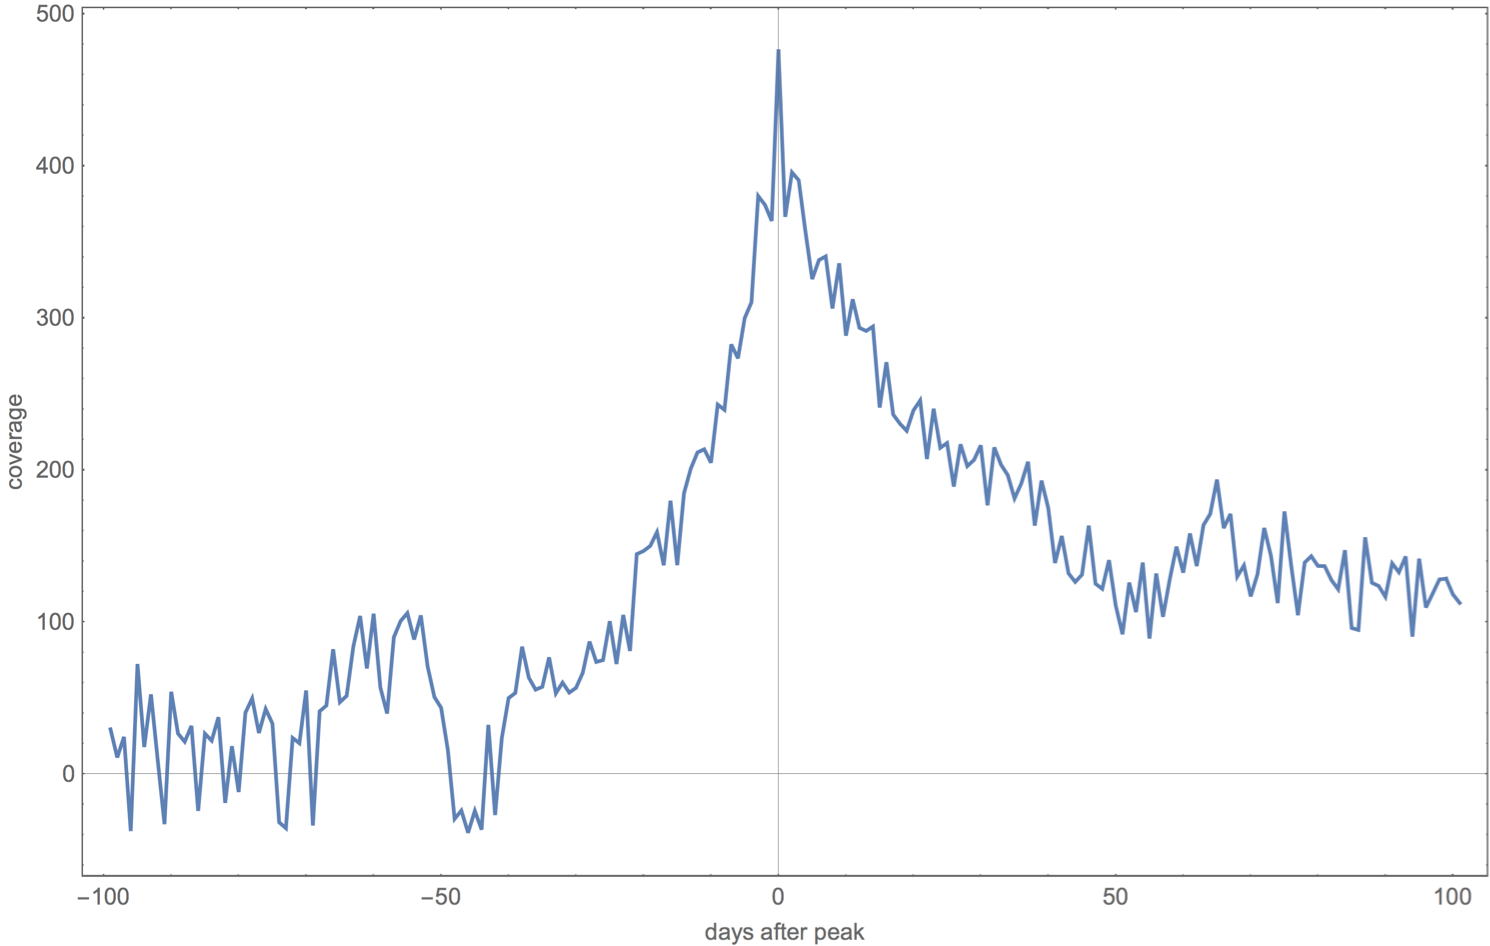
You can see how the main part of the coverage lasts for up to 50 days after the peak, and how there is more coverage of tsunamis after the peak than before (unsurprisingly). I continued to develop programmatic methods for analyzing these average peaks, making it possible to quantify things like the mean lifespan of news stories over time.