Ecosystem Dimension Reduction
March, 2023
This is an early draft.
The goal of this project is to use dimension reduction to characterize ecosystems by looking at the set of species that inhabit them.
Ecosystems are characterized by a combination of biotic (from living organisms) and abiotic (from physical processes) factors. For example, the ecosystems of the Amazon rainforest are affected by biotic factors like the the presence of lots of trees, but also by abiotic factors like abundant rainfall. However, these often interact in complicated ways. For example, the presence of trees in the Amazon affects rainfall, which in turn affects the vegetation.
Abiotic factors are often easier to observe than biotic ones. For example, the land temperature can be observed with satellites, but the presence of an ecologically important bird species cannot (at least directly). For this reason, projects like eBird correlate biotic factors (like the number of observations of a bird species) with abiotic ones (like the elevation) so that the presence of birds can be extrapolated to regions where there are few recorded observations.
However, with to rise of massive citizen science projects like eBird, direct observations of biotic factors have become more widespread. This raises the question: can we go the other way? Instead of estimating biotic factors from abiotic ones, is it possible to capture both by looking only at biotic ones?
Dimension Reduction
There are about 1 billion observations in eBird, covering most of the world. I created a program for parsing through the roughly 500GB of eBird observations and counting the number of species that appeared in a roughly-hexagonal grid covering the Earth. The result is a vector for every grid cell encoding whether a species is present in that cell. (I use a threshold of 100 observed individuals to characterize presence, though better heuristics could probably be developed.)
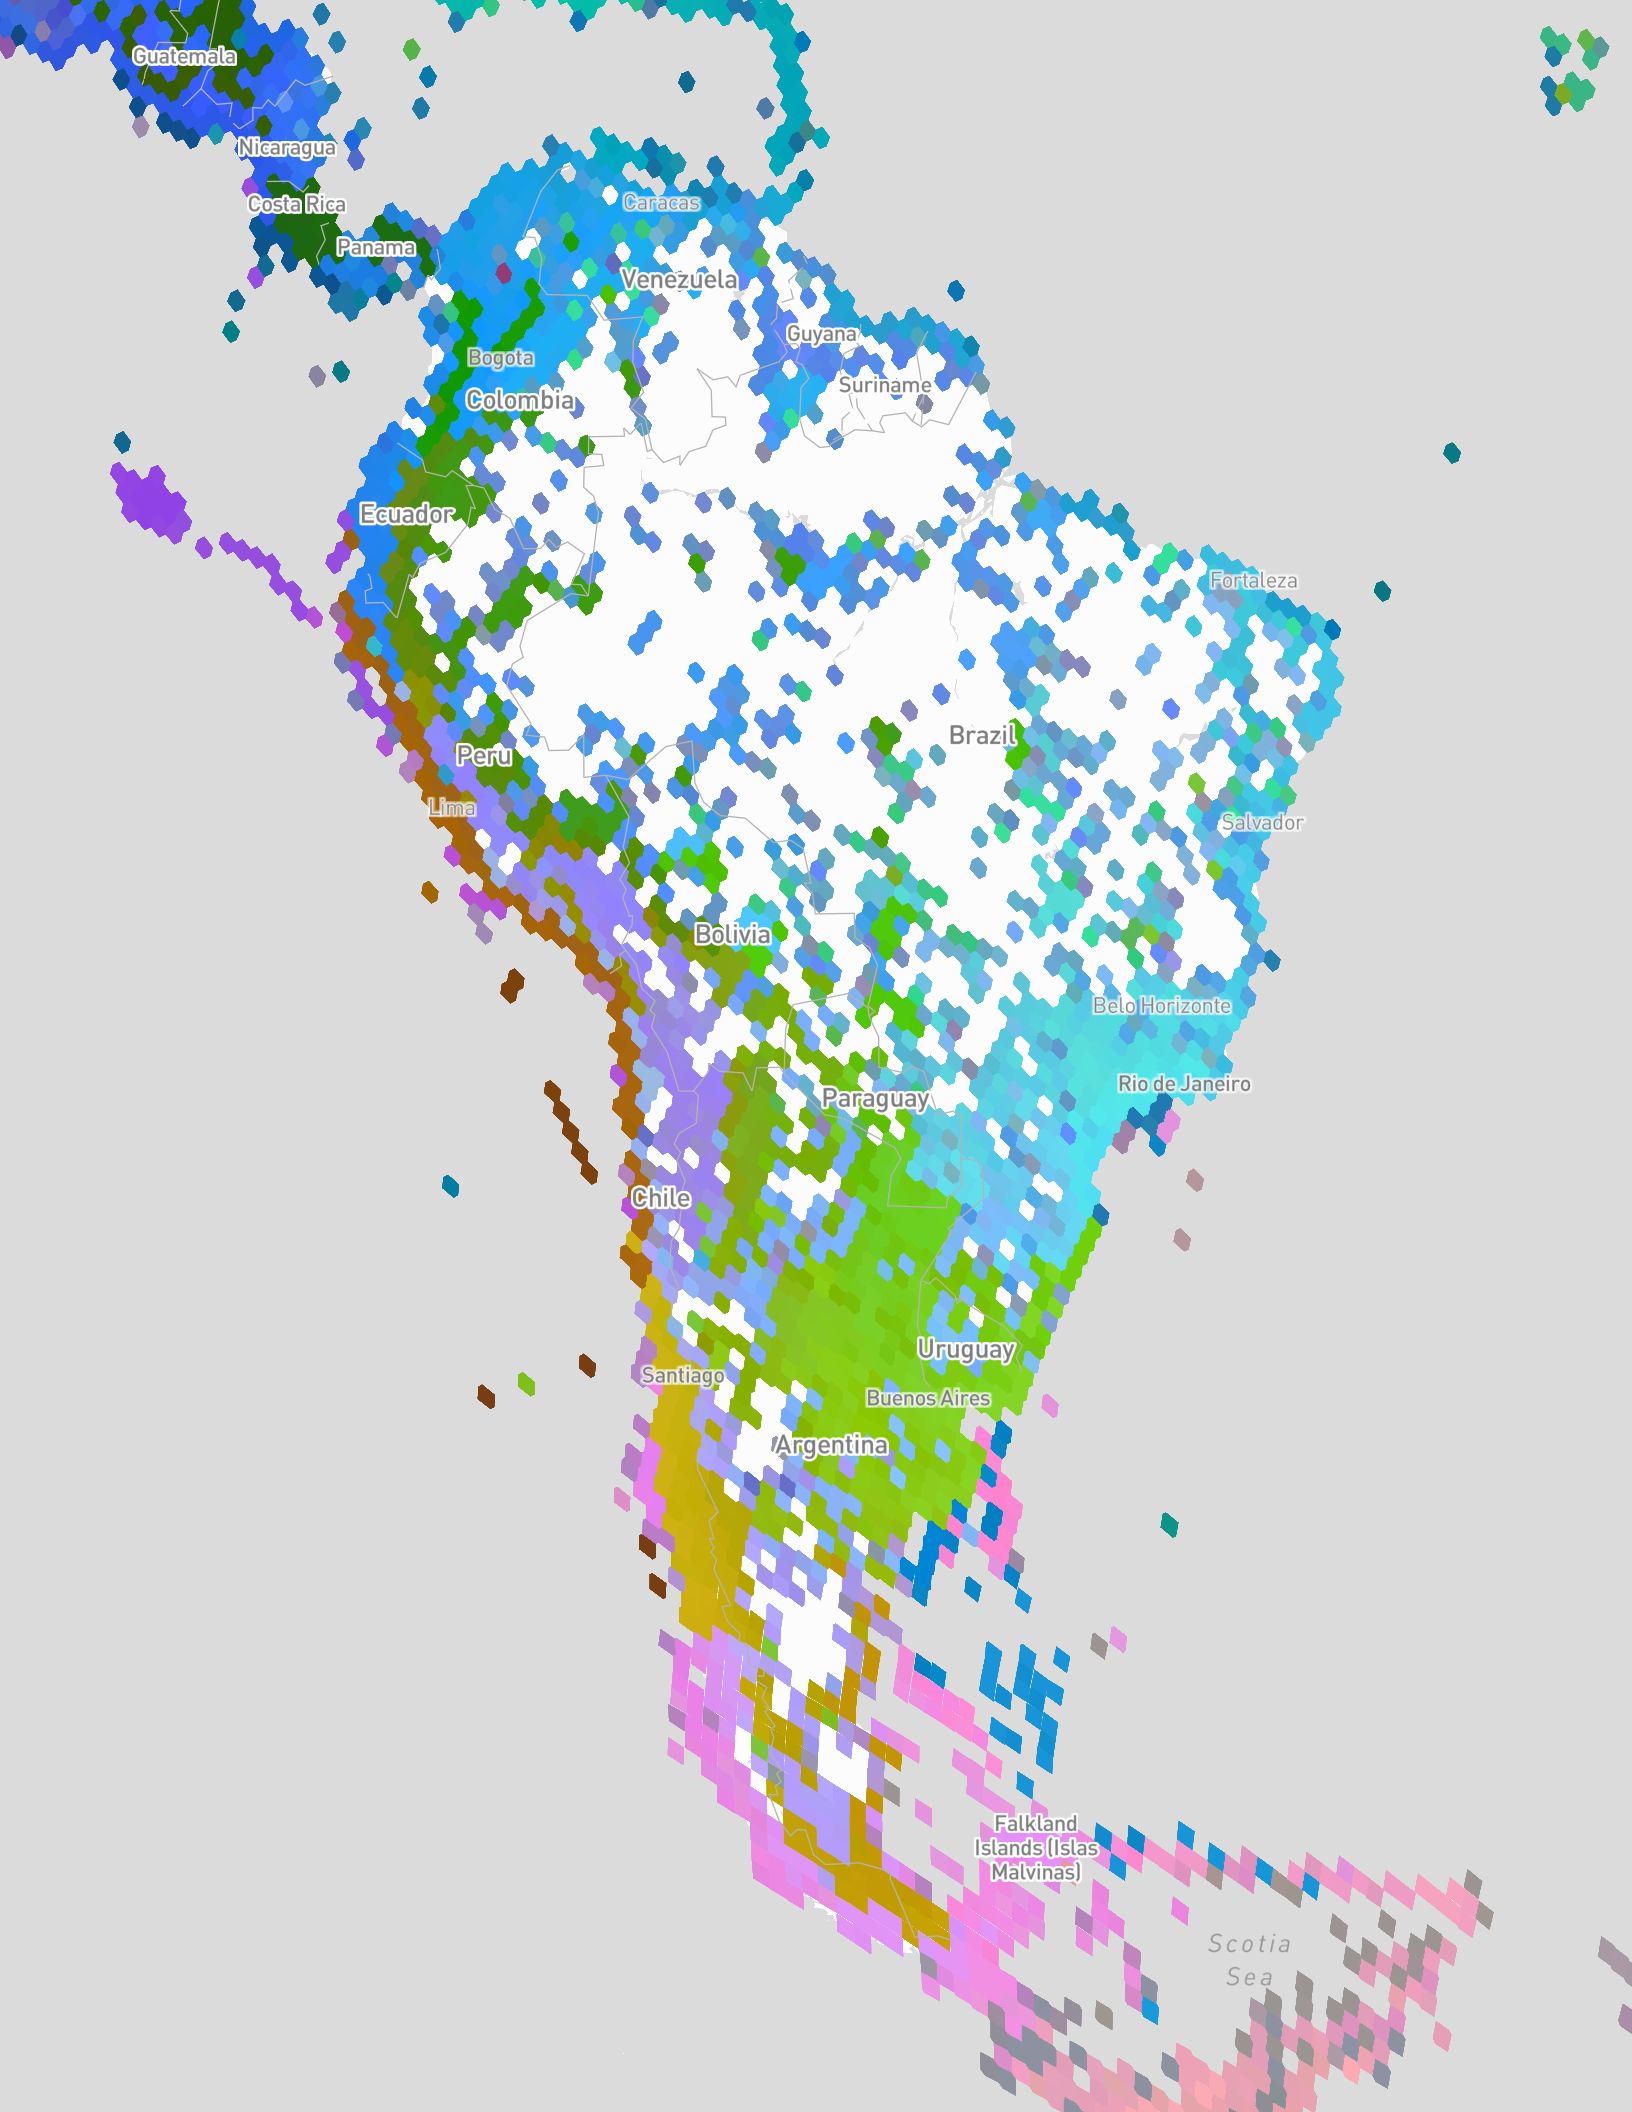
Running t-SNE dimension reduction over those vectors gives 3-dimensional points which encode much of the presence-absence information. Those vectors can be visualized by coloring their associated grid cells in an RGB color with the three dimensions assigned to the red, green, and blue channels, as shown in the interactive map below.
There are some fascinating effects captured by this map. First, the different colors of the continents shows how bird populations vary from continent to continent. This isn't surprising, but it is good that we see it.
Looking closer, however, reveals more detail. For example, South America is clearly broken down into different ecosystems on either side of the Andes, as well as around the Amazon (though there are large gaps in which there were too few observations).
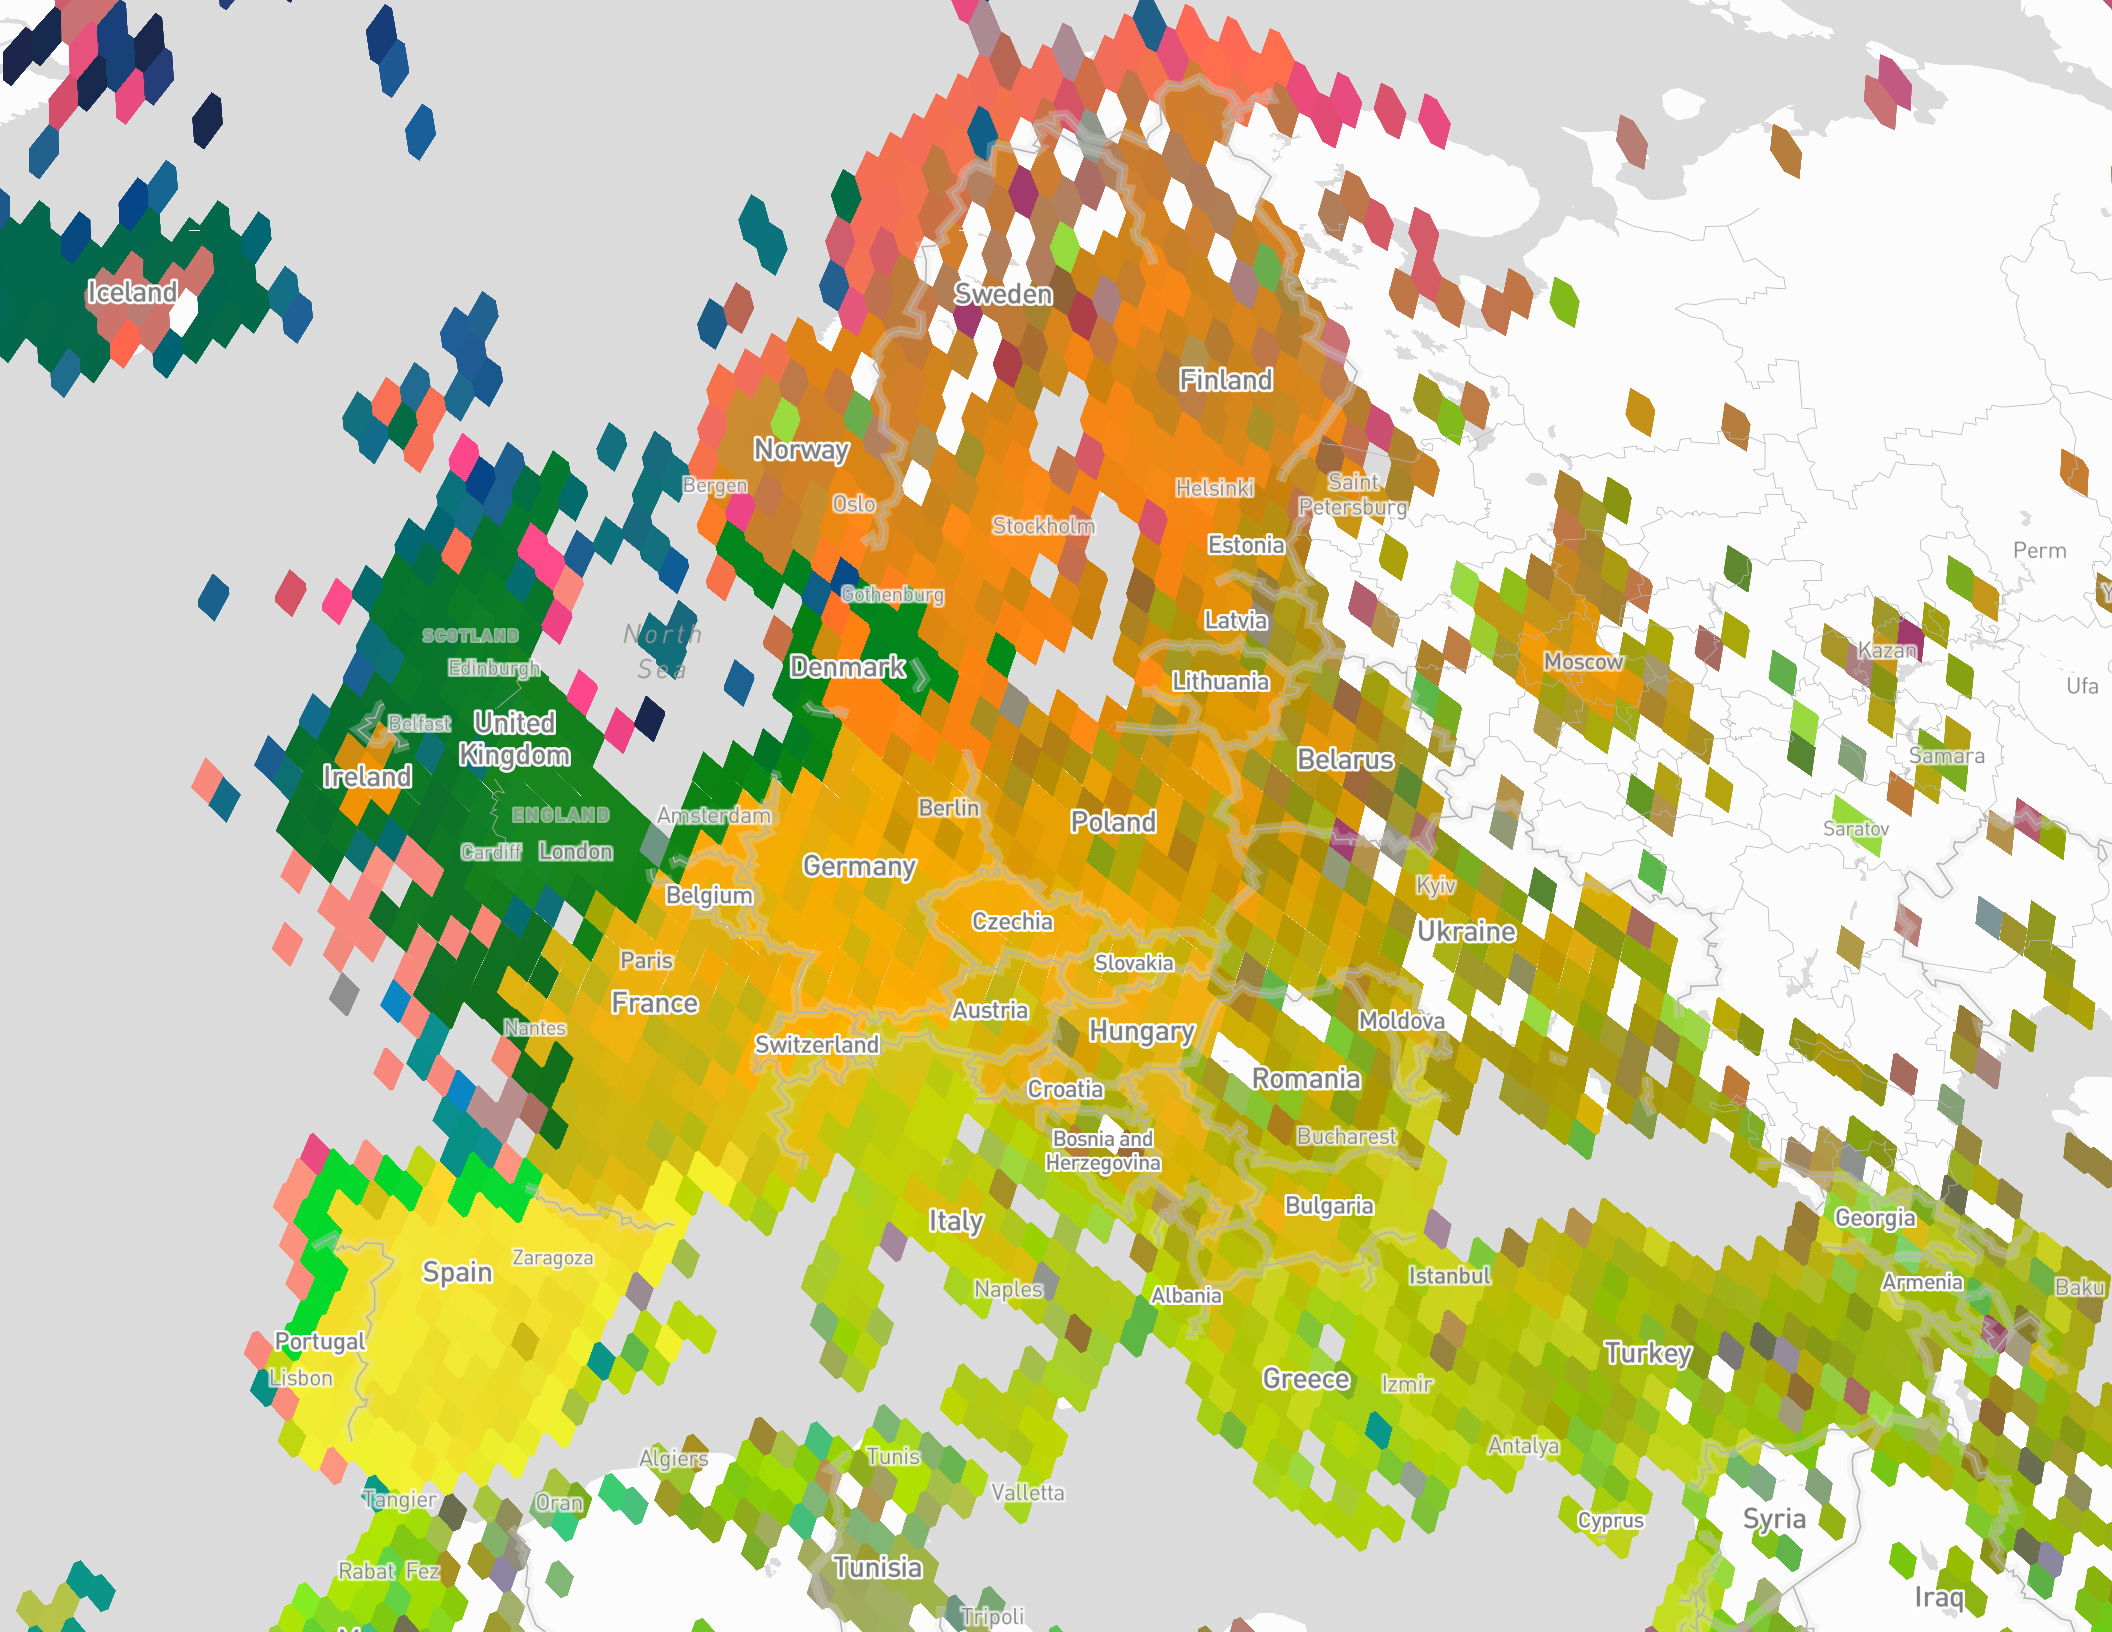
Europe also shows different ecosystems, though the transition is more gradual from the North to the South.
Adaptive Sampling
The observations from eBird are not uniformly distributed across the Earth. For example, of the roughly 1 billion observations in the dataset, more than half are from the United States.
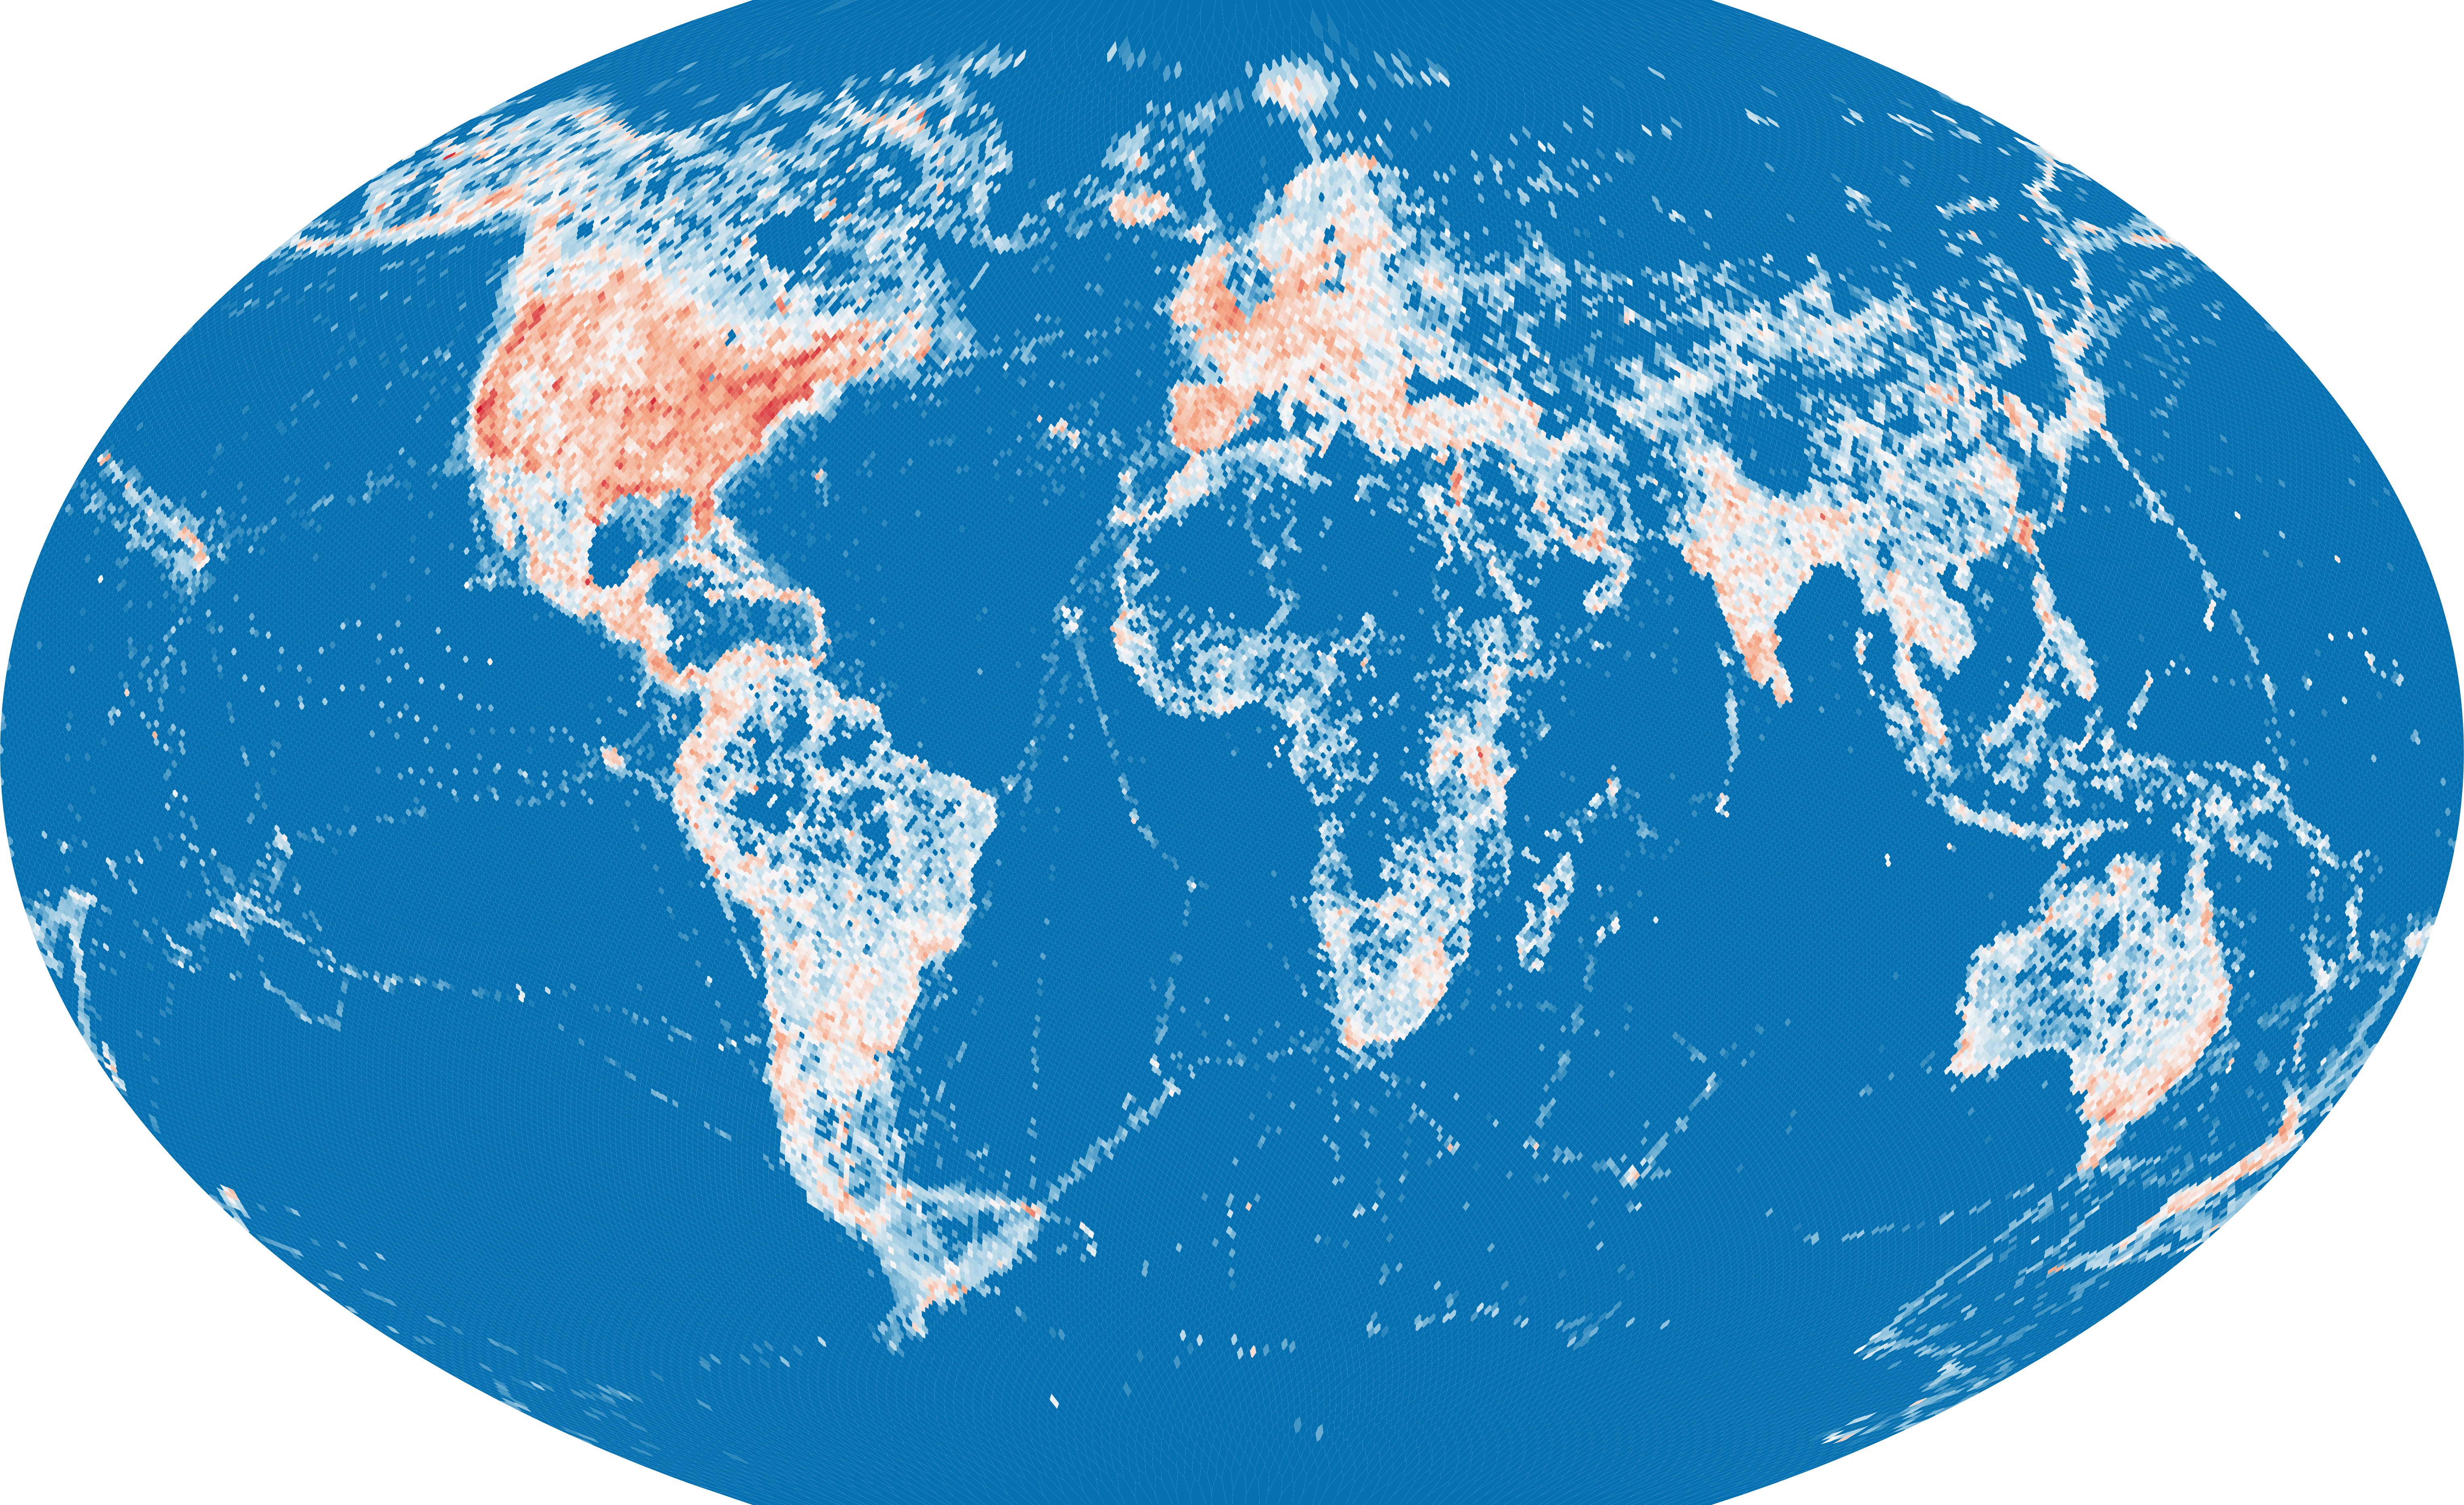
By using adaptive sampling that puts more, smaller grid cells in areas where there are more observations, much more detailed maps can be created.
Because it contains the most observations, the United States shows incredible detail.
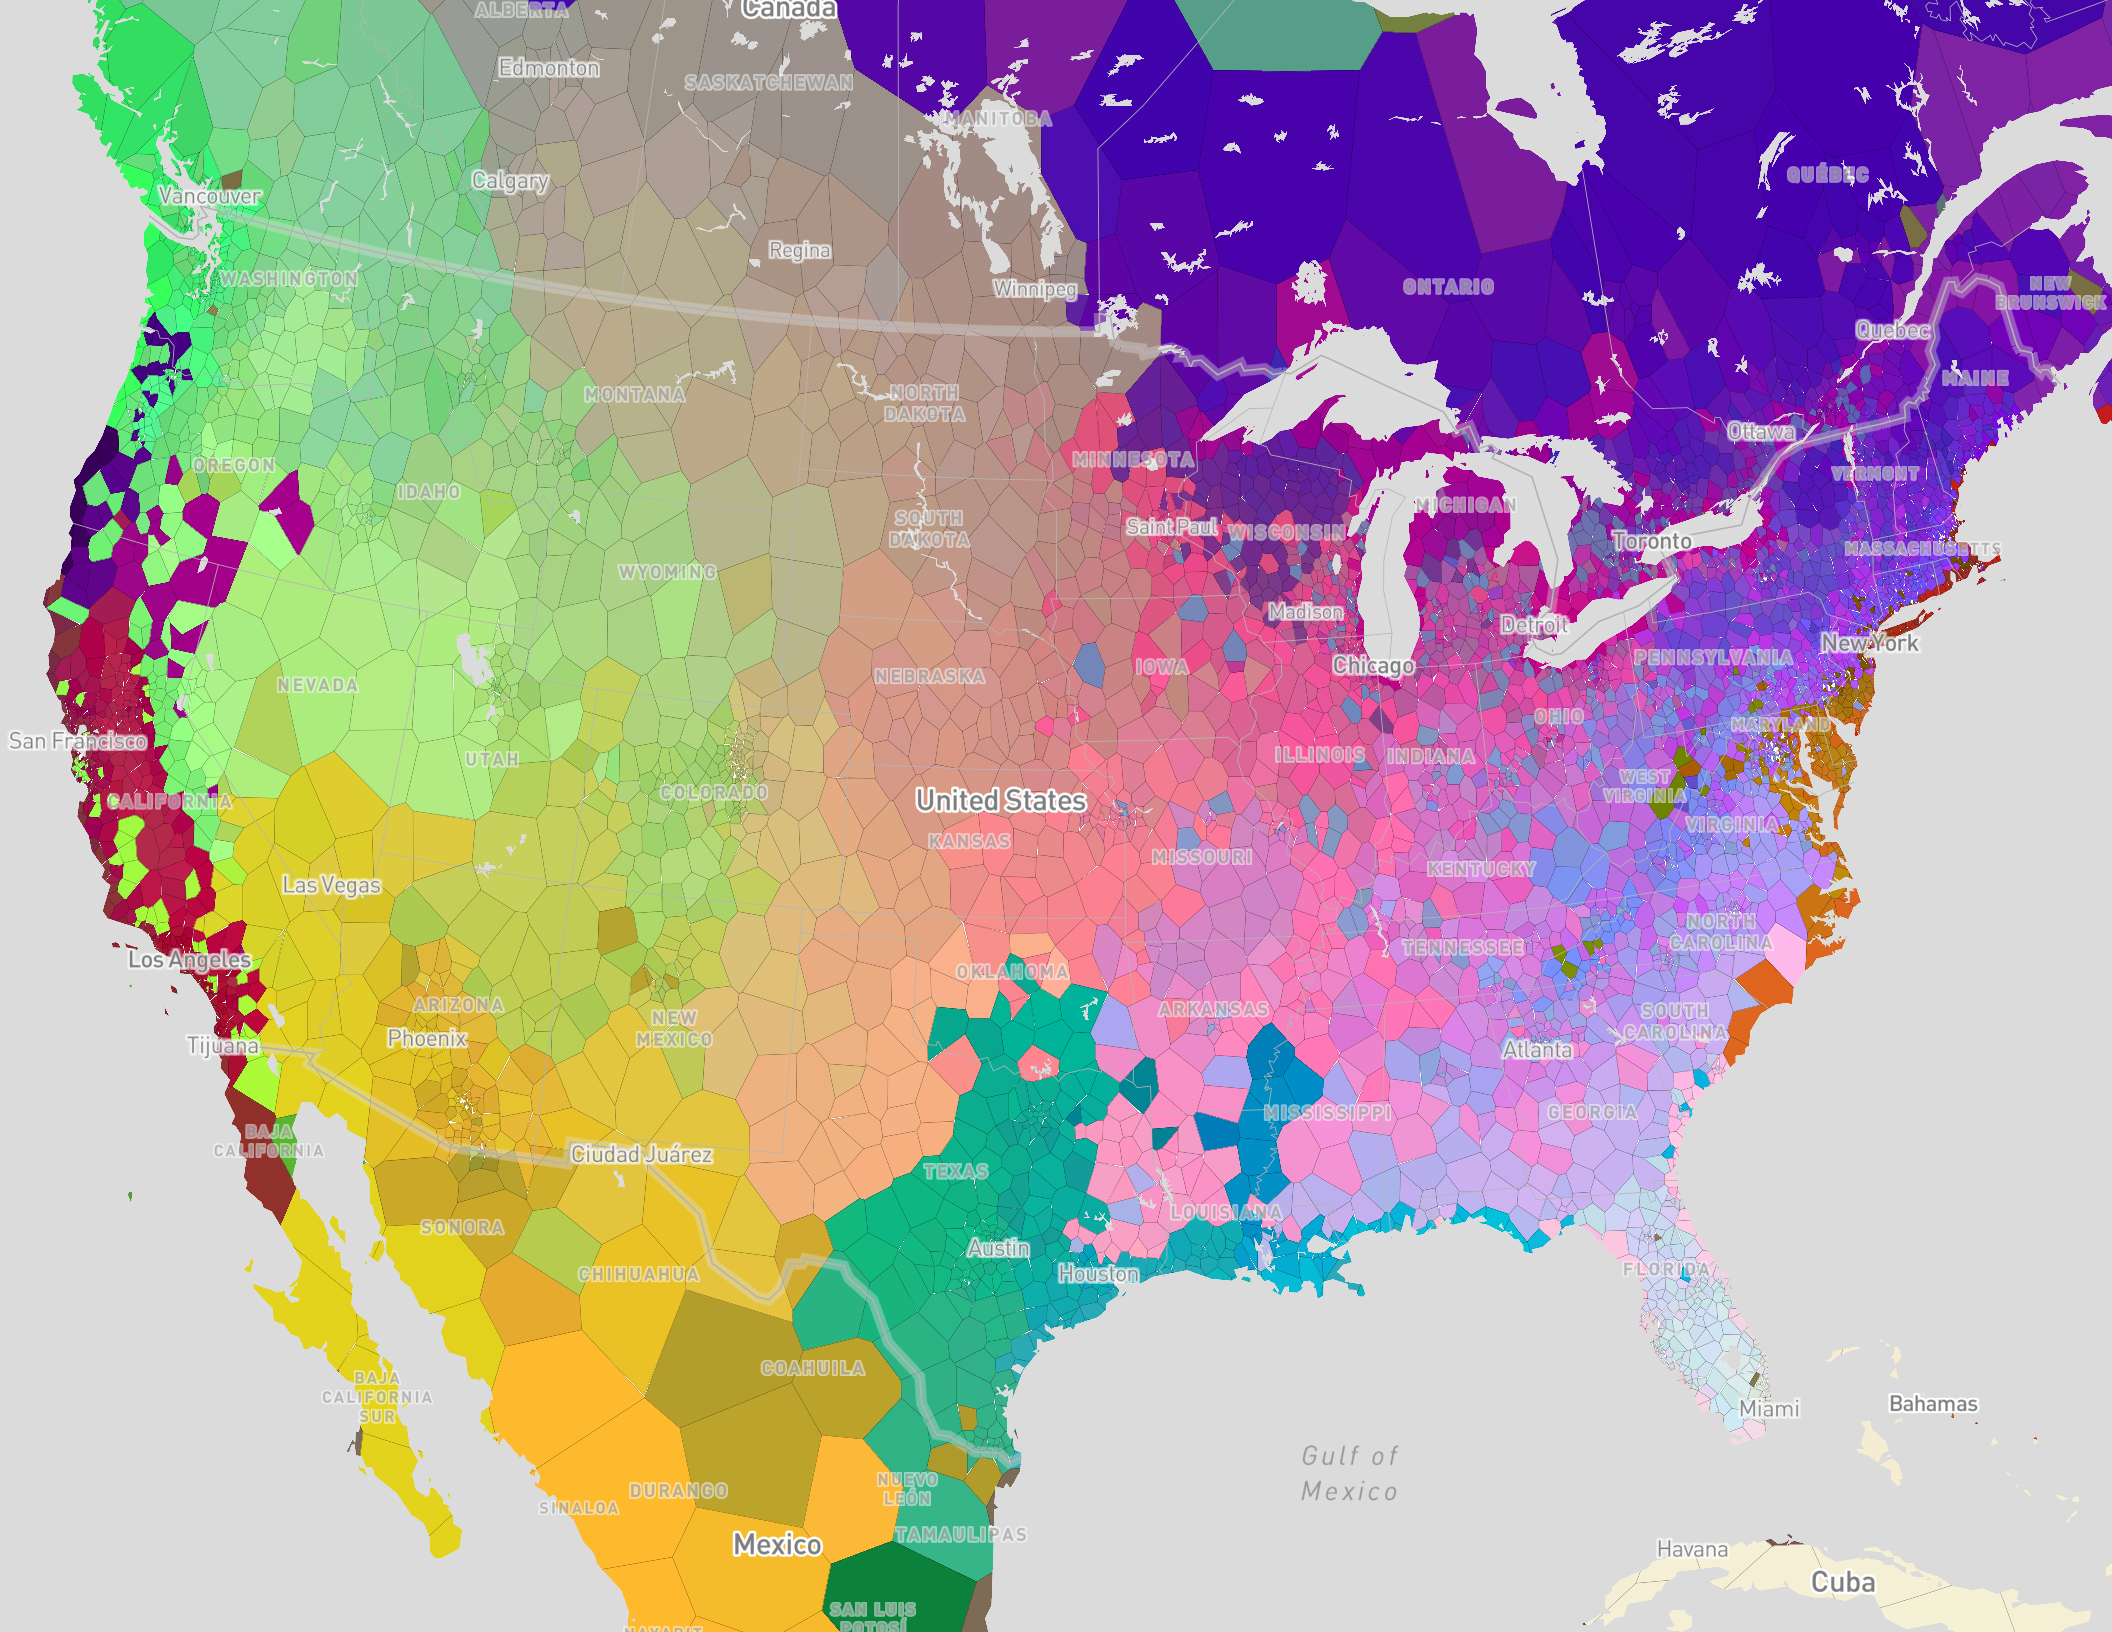
There are several interesting areas on that map. For example, several coastlines show different ecosystems from more inland areas (which makes sense given the number of coastal birds). California also shows lots of unique ecosystems, as well as Texas and the Gulf Coast. Otherwise, there is a gradual East-West gradient overlayed on the smaller features.